Business Intelligence & Operations Analysis
A visual summary of the complete data analysis project, from planning to final dashboard.
Phase 1: Business Understanding & Planning
Objective
To provide actionable insights for Sales, Marketing, Operations, and Finance to maximize revenue and gross profit.
Cross-Functional Stakeholders
- Sales & Marketing
- Operations & Supply Chain
- Finance & Planning
- Executive Leadership
End Result
An interactive Power BI dashboard to monitor KPIs, analyze trends, and support strategic decision-making based on Joint Business Plans (JBPs).
Success Criteria
- Improve forecast accuracy.
- Optimize inventory & safety stock.
- Increase margin realization.
- Enhance Marketing ROI.
Phase 2: Data Discovery & Architecture
Standard Practice: Data Warehouse Model
A robust, scalable approach to protect operational systems and optimize for analytics.
OLTP System
(e.g., MySQL)
ETL Process
(Extract, Transform, Load)
Data Warehouse
(e.g., Snowflake)
Power BI
(Analytics Tool)
For this project, a simplified approach was taken: Power BI connects directly to the MySQL database.
Phase 3: Data Analysis Using SQL
Database Setup
The team set up a local MySQL server and imported the entire database, including tables and records, from a `db_dump.sql` file.
Data Quality Issues Found
- Garbage Data: Irrelevant records for cities outside the business scope (e.g., New York, Paris).
- Inaccurate Values: Some transactions had negative sales amounts.
- Mixed Currencies: Transactions in both INR and USD required conversion.
SQL Queries for Insights
Total revenue in 2020:
SELECT SUM(t.sales_amount)
FROM sales.transactions t
JOIN sales.date d ON t.order_date = d.date
WHERE d.year = 2020;
Insight: Revealed a revenue decline from the previous year.
Total transactions in Chennai:
SELECT COUNT(*)
FROM sales.transactions
WHERE market_code = 'Mark001';
Insight: Quantified business volume in a key market.
Phase 4: Data Modeling & ETL for Retail Operations
Collected and integrated data from multiple sources (e.g., e-commerce platforms, inventory management systems, finance software) into a central model. Cleaned data to ensure accuracy and built a star schema in Power BI optimized for retail and distribution analysis.
Data Sources
Sales Systems (Sell-in/Sell-out), Inventory Management, Finance ERP, Marketing Platforms.
ETL Process
Used Power Query to extract, transform, and load data. Handled data quality issues like mixed currencies, inaccurate values, and duplicates.
Data Model
Created a star schema with a central `transactions` table linked to dimensions like `Customers`, `Products`, `Date`, and `Markets`.
Phase 5: Building the Dashboard
Final Data Cleaning
Addressed duplicate currency entries (e.g., 'INR' and 'INR\r') by filtering the data in Power Query to only keep the correct, majority records, ensuring data integrity.
Creating DAX Measures
Created a dedicated table for base measures using DAX (Data Analysis Expressions) to define key calculations for the dashboard.
Revenue = SUM(sales_transactions[normalized_sales_amount])
Sales Quantity = SUM(sales_transactions[sales_quantity])
Dashboard Components
The final dashboard was built using a variety of interactive visuals:
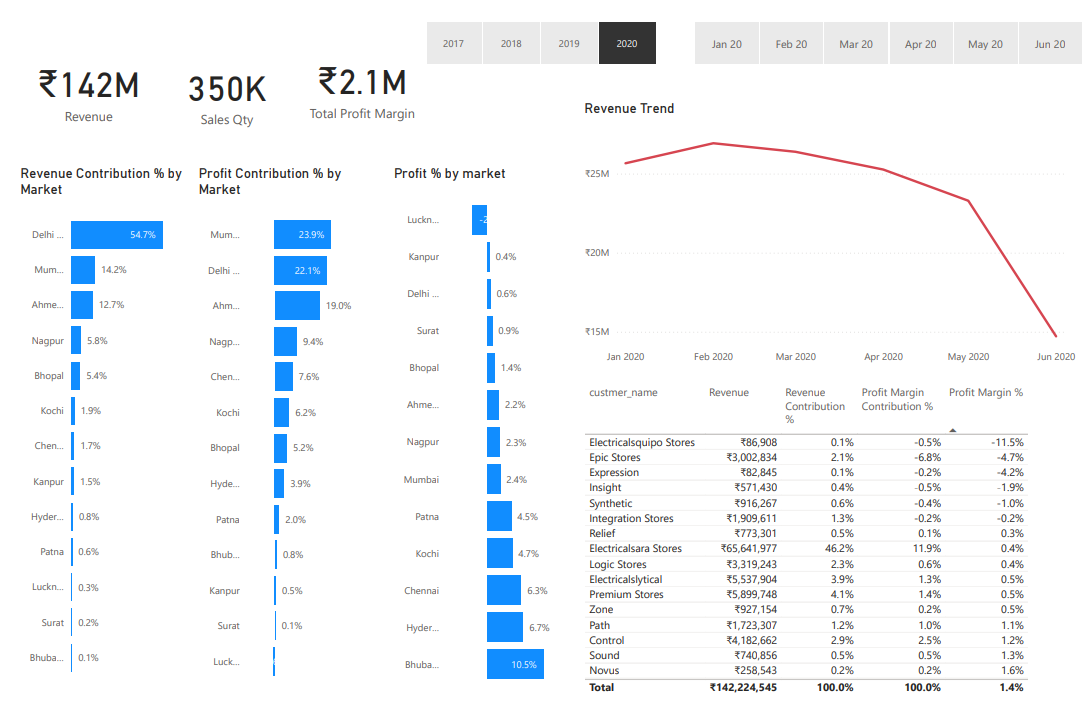
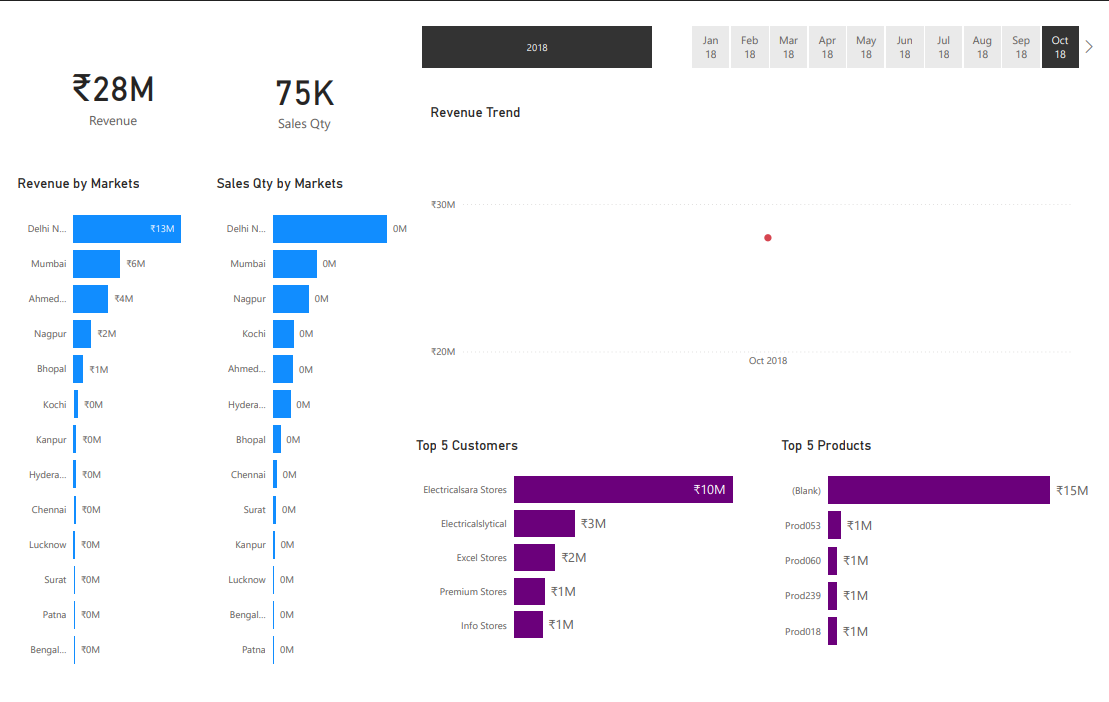
- KPI Cards: For at-a-glance totals of Revenue and Sales Quantity.
- Slicers: Horizontal buttons for filtering by Year and Month.
- Bar Charts: To compare revenue/quantity by market, and to show Top 5 customers and products.
- Line Chart: To visualize the revenue trend over time, highlighting business performance.
Phase 6: Iteration & Final Enhancements
Bug Fixes & Usability
- Corrected Revenue: Fixed a critical bug by updating the Revenue measure to use the `normalized_sales_amount` column, ensuring accurate financial reporting.
- Improved Interaction: Changed the default visual behavior to "cross-filtering" instead of "highlighting" for a more intuitive user experience.
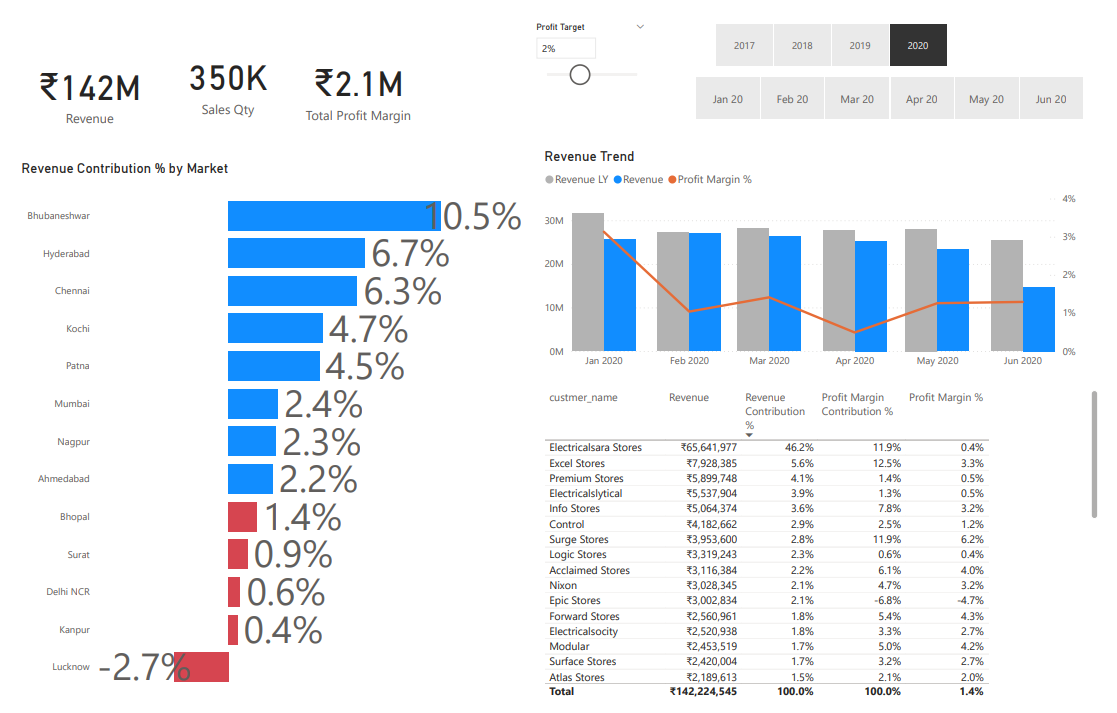
Profitability Analysis
Added `cost_price` and `profit_margin` columns to the data model. Created new DAX measures to analyze profitability, uncovering deeper insights.
Profit Margin % = DIVIDE([Total Profit Margin], [Revenue], 0)Insight: Revealed that the highest revenue markets were not the most profitable, shifting focus to markets with better ROI.
Dynamic Performance
Created a new "Performance Insights" page with a dynamic profit target slider. Conditional formatting highlights underperforming zones in red, allowing for immediate performance assessment.
Publish & Collaborate
The final report is published to the Power BI web service, enabling cloud-based access and collaboration features like:
- Exporting to PDF/PowerPoint.
- Creating personal and report-level bookmarks.
- Collaborating via comments.
- Scheduling data refreshes.
Power BI Dashboard Previews
Sales Overview
Performance Insights
Profit Analysis